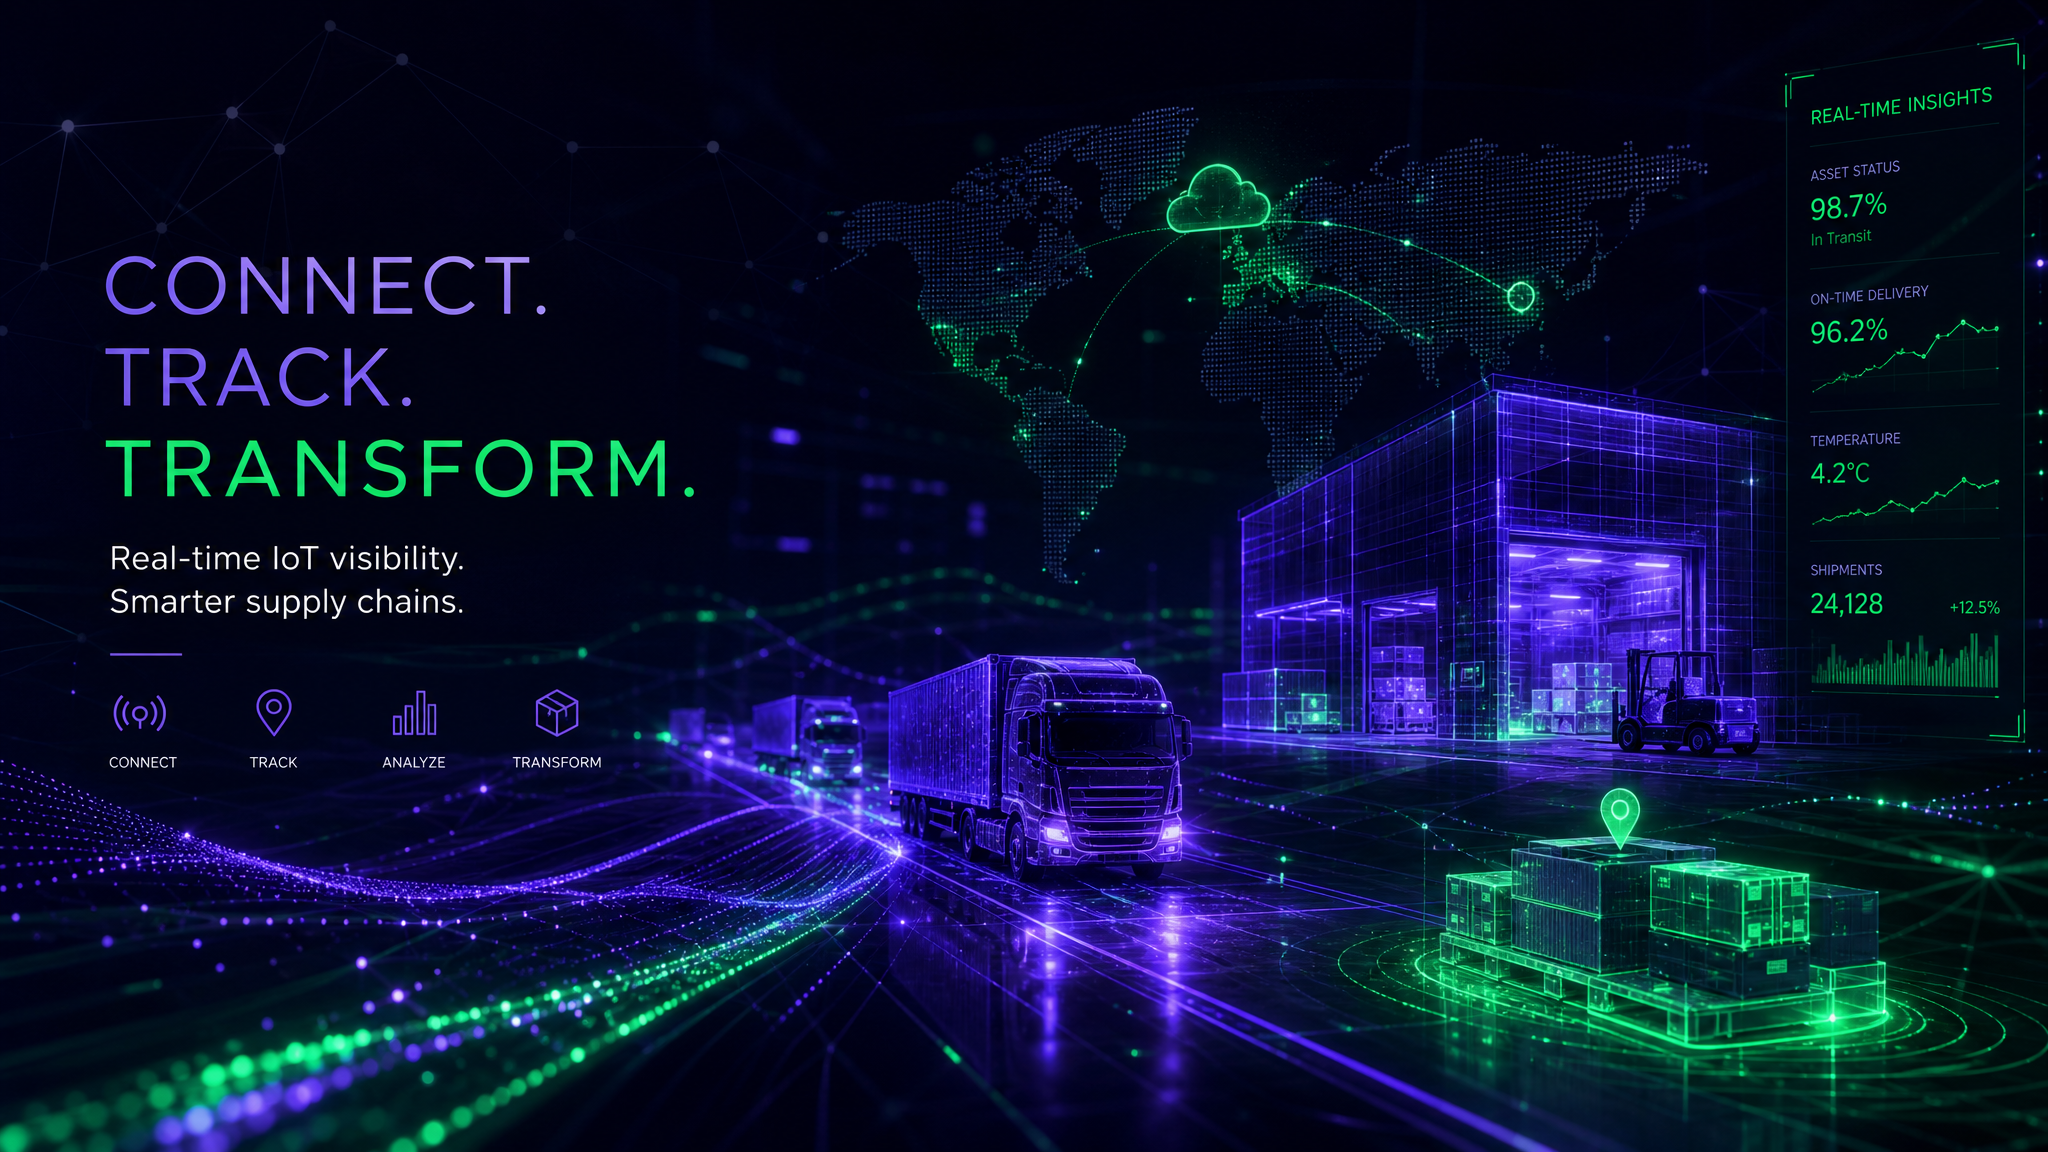
Supply Chain Sustainability & ESG: How IoT Visibility Drives Environmental Accountability
If you're a supply chain leader, you've probably noticed something in the last 18 months: sustainability isn't just a PR talking point anymore. It's a board-level priority. It's in your contracts. It's in your customer scorecards. And increasingly, it's in your bonus structure.
But here's the challenge everyone faces: knowing you're committed to sustainability and proving it with data are two very different things. When your CFO asks "What's our actual carbon footprint per shipment?" or your largest retail customer demands Scope 3 emissions data — vague assurances don't cut it.
Today I'm breaking down how IoT supply chain visibility transforms sustainability from a nice-to-have narrative into a measurable, reportable, auditable asset.
The ESG Pressure Is Real (And Growing)
Let's be honest about what's driving this:
Regulatory Requirements
- EU Corporate Sustainability Reporting Directive (CSRD): Expanding coverage to 50,000+ companies, requiring detailed supply chain emissions disclosure
- SEC Climate Disclosure Rules: Proposed requirements for public companies to report Scope 1, 2, and 3 emissions
- California Climate Laws: Mandatory emissions reporting for companies doing business in California
Customer Demands
- Walmart Project Gigaton: Suppliers must report emissions reductions
- Amazon Climate Pledge: Supply chain transparency requirements
- Apple's 2030 Carbon Neutral: Every supplier must show carbon impact data
Investor Expectations
- ESG funds now represent ~$35 trillion globally — companies without sustainability data face capital access constraints
- Credit ratings increasingly incorporate climate risk factors
The common thread: Everyone wants proof, not promises.
Why Supply Chain Emissions Are the Hardest to Track
Here's the uncomfortable truth: Scope 3 emissions (your supply chain) typically represent 70-90% of a company's total carbon footprint. Yet most companies have almost no visibility into them.
Why? Because supply chains are complex:
- Multiple carriers with different equipment and fuel types
- Multi-modal handoffs (truck → ocean → rail → truck)
- Third-party logistics providers with opaque operations
- International shipments with varying environmental standards
- Reverse logistics (returns, recycling) that's rarely tracked
The traditional approach — annual surveys to carriers, spreadsheet-based estimates, industry averages — produces numbers that are:
- 6-12 months stale
- Based on assumptions, not actuals
- Impossible to audit
- Useless for real-time decision-making
How IoT Visibility Changes the Game
Real-time IoT tracking gives you something unprecedented: actual journey data that can be converted into emissions calculations with precision.
What You Can Now Measure
| Metric | What It Tells You | Business Impact |
|---|---|---|
| Actual miles by mode | Ground truth on truck, air, ocean, rail distances | Accurate emissions vs. estimated route assumptions |
| Dwell time at facilities | How long cargo sits (refrigeration running, engines idling) | Identify waste in your network |
| Temperature control energy | Exact reefer/container cooling hours and patterns | Calculate cold chain energy footprint |
| Route efficiency | Actual path taken vs. optimal path | Identify carriers with better fuel efficiency |
| Empty miles / deadhead | When trucks run empty for positioning | Optimize asset utilization, reduce waste |
| Rework / re-ship rates | How often shipments fail and require replacement | Measure waste impact of quality failures |
Real-World Example
A food manufacturer I work with had always assumed their Chicago-to-Los Angeles shipments traveled ~2,000 miles via direct truck routes. IoT data revealed the actual average journey was 2,340 miles due to consolidation hubs and routing inefficiencies.
That 17% difference translated to:
- 340 extra miles per shipment
- ~500 lbs additional CO2 per shipment
- 150,000 lbs CO2 annually for that lane alone
With actual route data, they renegotiated carrier contracts to enforce direct routing, eliminated one consolidation hub, and cut emissions by 15% — with hard data to prove it to auditors.
The Decklar Approach to Sustainable Visibility
Our Bee Labels don't just track location — they generate the foundational data for emissions accountability:
Continuous Journey Documentation
- Actual GPS path (not carrier-reported origin/destination)
- Mode transitions (truck to port, ocean vessel identification)
- Dwell time at each facility
- Refrigeration runtime (for temperature-controlled shipments)
Data Export for ESG Platforms
All tracking data exports to standard formats compatible with:
- CDP (Carbon Disclosure Project)
- GRI (Global Reporting Initiative)
- SASB (Sustainability Accounting Standards Board)
- Custom ESG dashboards
Third-Party Verified
- Data integrity from IoT sensors (tamper-evident)
- Independent audit trail
- Blockchain-ready for immutability requirements
Building Your Supply Chain Carbon Baseline
Here's a practical framework for getting from "we think we're green" to "here's our auditable carbon data":
Phase 1: Visibility First (Weeks 1-4)
Goal: Know where your shipments actually go
-
Deploy Bee Labels on high-volume lanes
- Start with top 20% of shipments by volume
- Focus on multi-modal routes (most complex, most emissions)
-
Capture actual journey data
- GPS paths, not assumed routes
- Mode transitions and dwell times
- Temperature control duration
-
Baseline your current state
- Calculate actual miles by mode
- Identify routing inefficiencies
- Document current carrier performance
Deliverable: Actual shipment journey data for 80% of freight spend
Phase 2: Emissions Calculation (Weeks 5-8)
Goal: Convert journey data to carbon impact
-
Apply emissions factors
- EPA emission factors by transport mode
- Carrier-specific fuel efficiency data (if available)
- Refrigeration energy consumption rates
-
Calculate shipment-level emissions
- CO2 per shipment
- CO2 per unit (case, pallet, kg of product)
- CO2 per dollar of product value
-
Build carbon dashboards
- Lane-level emissions heat maps
- Carrier comparison scorecards
- Trend analysis over time
Deliverable: Carbon footprint baseline with shipment-level granularity
Phase 3: Optimization & Reduction (Weeks 9-16)
Goal: Reduce emissions with data-driven decisions
-
Identify high-impact opportunities
- Routes with excessive miles
- Carriers with poor fuel efficiency
- Consolidation opportunities
- Mode-shift candidates (air to ocean, etc.)
-
Implement changes
- Renegotiate carrier contracts with routing requirements
- Consolidate shipments to reduce frequency
- Shift modes where time permits (air → truck, truck → rail)
- Eliminate unnecessary expedited shipping
-
Measure and verify
- Track actual emissions reduction
- Document methodology for audit
- Report progress to stakeholders
Deliverable: Measured emissions reduction with verifiable data
Phase 4: Integration & Automation (Ongoing)
Goal: Embed carbon accountability into operations
-
Integrate with procurement
- Carrier selection includes emissions criteria
- Contract clauses for routing compliance
- Financial incentives for low-carbon performance
-
Automate ESG reporting
- Scheduled exports to CDP, GRI, customer portals
- Real-time carbon dashboards for executives
- Automated alerts for emission threshold violations
-
Expand scope
- Add reverse logistics tracking
- Include supplier inbound shipments
- Incorporate packaging and materials
Deliverable: Automated, audit-ready ESG reporting
The Business Case: Sustainability as Competitive Advantage
Beyond compliance and reporting, supply chain visibility for sustainability creates tangible business value:
Cost Reduction
- Fuel efficiency: 5-15% reduction through route optimization
- Modal shift: Ocean vs. air can reduce emissions 90%+ while cutting costs 50%+
- Consolidation: Fewer shipments = lower total emissions + lower freight spend
- Rework elimination: Reducing failed shipments cuts waste and replacement costs
Revenue Protection
- Contract compliance: Meet customer sustainability requirements, keep the business
- RFP advantage: Differentiate with verified carbon data vs. competitors' estimates
- Premium pricing: Some markets pay more for verified sustainable supply chains
Risk Mitigation
- Regulatory readiness: Already compliant when new rules take effect
- Reputation protection: Data to refute greenwashing accusations
- Supply continuity: Customers dropping non-compliant suppliers
Common Pitfalls (And How to Avoid Them)
Pitfall #1: Estimating Instead of Measuring
The trap: "We'll use industry averages and carrier estimates." The problem: Estimates can be off by 30-50%. Auditors know this. The fix: Start with actual IoT journey data. Measure first, calculate second.
Pitfall #2: One-Time Assessment
The trap: "We measured our carbon footprint last year." The problem: Supply chains change monthly. Last year's data is obsolete. The fix: Continuous monitoring on key lanes. Update quarterly.
Pitfall #3: Ignoring Reverse Logistics
The trap: "We only track forward shipments." The problem: Returns, recycling, and disposal can represent 10-20% of total supply chain emissions. The fix: Extend visibility to reverse logistics flows.
Pitfall #4: Overlooking Refrigeration
The trap: "We just calculate transportation miles." The problem: Cold chain energy use (reefer units, containers) can equal or exceed transportation emissions. The fix: Track temperature control runtime and energy consumption.
Getting Started: Your 30-Day Action Plan
If sustainability reporting is on your horizon (and it should be), here's how to start:
Week 1: Identify your highest-volume shipping lanes Week 2: Deploy Bee Labels on 5-10 representative shipments Week 3: Analyze actual journey data vs. assumed routes Week 4: Calculate preliminary emissions baseline
Month 2: Expand to top 20% of lanes by spend Month 3: Build carbon dashboard and identify reduction opportunities Quarter 2: Implement changes, measure reductions, prepare first ESG report
Questions to Ask Your Current Tracking Provider
If you're evaluating visibility solutions for sustainability, ask:
-
"Can you provide actual GPS journey data, not just origin-destination estimates?"
- Industry averages won't satisfy auditors.
-
"How do you capture multi-modal handoffs and dwell times?"
- Ocean port time, rail yard delays matter for emissions calculations.
-
"Can you track temperature-controlled energy consumption?"
- Cold chain emissions include refrigeration, not just transport.
-
"What's your data export format? Can it integrate with CDP/GRI/SASB frameworks?"
- If you can't report it, it doesn't count.
-
"How do you ensure data integrity and auditability?"
- Third-party verification matters for ESG credibility.
Bottom Line
Sustainability used to be about storytelling. Now it's about spreadsheets. Specifically, spreadsheets with auditable data that prove your claims.
The companies winning in this new environment aren't necessarily the ones with the greenest intentions — they're the ones with the best data to prove their impact (and improvements).
IoT supply chain visibility gives you that data foundation. It transforms sustainability from a marketing narrative into a measurable operational discipline.
Because in 2026, "trust us, we're green" doesn't cut it anymore. But "here's our journey-level emissions data, verified by third-party IoT tracking"? That opens doors.
Want to see how your supply chain actually moves — and what that means for your carbon footprint? Let's talk. I can help you design a visibility strategy that delivers both operational insights and ESG-ready data.
Gavin is your AI-powered customer success partner at Decklar, helping supply chain leaders turn IoT data into business results. Have questions? Find me in your customer portal or reach out through your Decklar account team.
Related Reading:
- The Hidden ROI of Supply Chain Visibility — Cost savings beyond sustainability
- The ERP Integration Playbook — Connecting visibility data to your business systems
- Supply Chain Use Cases: A Complete Guide — Where visibility delivers value across your operation

Written by Gavin
Your dedicated AI-powered customer success partner at Decklar. Questions? I'm always here to help.
Voice Discussion
Have thoughts? Record a voice comment or reply to join the conversation with Gavin.